
Click above to listen to story.
The eternal investment question – “do I invest my money all at once or do I invest smaller amounts at predetermined intervals?” Otherwise known as lump sum investing vs. dollar cost averaging, or as our US colleague Jeff Troutner once termed it: wading vs. plunging.
What’s the best option? Before that, what’s behind the question in the first place? Fear and uncertainty. Fear of making a financial mistake because of uncertainty about the future. Both losing money and making a mistake can make us feel a little silly, but we need to acknowledge uncertainty is merely life we haven’t yet lived and there are no right or wrong decisions about things we couldn’t see. In hindsight we’ll often reanalyse a decision that didn’t go our way and agonise with some “coulda, woulda, shoulda” groaning and grumbling.
Usually this is done by going over information that came to hand after the decision. When investing we should never beat ourselves up over such things. The best decision is always the most informed one made according to the information we have at hand.
So, the wade vs. plunge is like many other investment dilemmas, a question about a short-term future that we cannot see. How to inform yourself? The most useful guidebook is historical data. This allows us to make a decision that has at least been educated by analysis on what worked in the past using varying market conditions.
To answer the question, we analysed our model portfolios over the 360 monthly starting dates between January 1990 and December 2019 and measured their returns over the following 12 months. We did so by comparing $1,000 invested in 12 monthly increments (the wade), verses $12,000 being wholly invested in the first month (the plunge). To ensure an accurate comparison of returns, any money that was not invested in the wade portfolio was deemed to have earned the cash rate of the day until contributed to the portfolio.
We looked at our Domestic and Global share portfolios, and then our diversified portfolios. the numbers reflect the percentage of growth and defensive assets in each portfolio.
The results were not surprising.
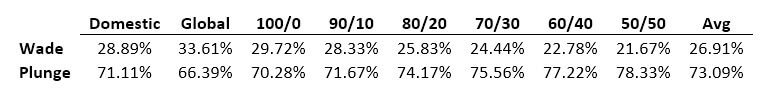
Over the 30 years plunging won around 70% of the time.
For the most part, plunging is a function of how often markets are either up or down on a monthly basis, and to some extent, what the cash rate is at the time. Historically most equity markets have shown to be positive 60-70% of the time. As portfolios become more defensive their chance of successfully plunging increases as they are dictated less by the weight of more volatile assets such as stocks and listed real estate.
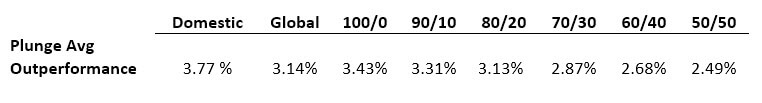
Another unsurprising result, the average outperformance of plunging over wading.
Best years to begin a 12-month wade? 2007 & 2008, which makes sense. In falling markets any money not in the market can’t be affected by falls. 2002, due to the downturn after the dotcom bubble, 9/11 and some major accounting scandals cast doubt across US companies.
1990, the fourth best year to wade, might be considered the most interesting year. Sharemarket returns were incredibly poor in 1990, and in contrast, the cash rate was very high. If you started a wade in January 1990, 12 months later, the cash waiting to be deployed into the portfolio had earned over $900. By December 2019 (the last starting month in the experiment) the cash waiting to be deployed earned $25!
That type of high interest rate environment is one instance where an investor can arguably afford to bide their time. Ignoring whatever the market is doing, if an investor can get 16% return on their cash as they wade it into a portfolio, it’s still a fair result. Though it should be acknowledged if cash is returning 16%, then inflation is running very high.
The best years to plunge? 1995, 1996, 2003, 2004, 2005, 2012, 2013, 2016 and 2017. Across all the portfolios, every starting plunge month in those years beat wading. Again, a function of how strong equity markets were during those start periods and their following 12 months.
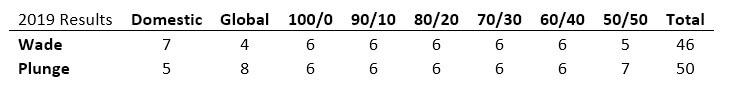
The other interesting year to consider – 2019. Because a 12-month period that starts in April 2019 finishes in March 2020, we get to see the impact of COVID on many of the results. It’s emblematic of any market downturn. In several instances starting in 2019, whether plunging or wading won, it wasn’t much of a boast because both options saw a decline in value. It was just a case of who lost the least.
It was most beneficial to start wading in December 2019. The opportunity to continually put money into the market as it crashed due to covid, and swiftly recovered due to fiscal and monetary policy stimulus, offered a huge upside against having every dollar invested during the crash. However, the wade assumes regimented, robot-like behaviour. Doing the exact same thing every month. Humans aren’t always so inclined.
This raises the inevitable behavioural issue. The plunge is one decision. The wade invites further opportunities to delay. As noted, anyone who has decided to wade is potentially doing so out of fear. Wading generally performs better in tougher markets because an investor is less exposed to any falls. If the market rapidly falls when they are halfway through their wade, are they likely to continue with it, or delay further until they feel safe?
Is this 30-year period an accurate enough representation to gain an understanding of what decision an investor should take? Yes and No. Yes, if you expect capitalism to keep functioning and markets to reward investors for supplying capital and delivering positive returns two out of every three months on average. No, because 1990 to 2019 has already happened and the future will be different.
Our suggestion is not letting fear of the unknown dictate investment decisions.
A dotcom crash, 9/11, two wars in Iraq, a war in Afghanistan, high interest rates, low interest rates, a global financial crisis, a volcano eruption that disrupted a continent, multiple tsunamis, one that caused a nuclear reactor to meltdown, trade wars, geopolitical tensions, economic unions splitting, a currency crisis in Asia, countries defaulting on their debt, multiple outbreaks of respiratory viruses, one that shutdown the world for a brief period.
Just some of the events that occurred during the period measured. Few were expected. The point is, there will always be an event around the corner that we don’t expect. This experiment is useful to make a rational decision on why an investor should plunge instead of wade, but starting is only one aspect of investing. Eventually a portfolio will be fully allocated. At that point there’s no hiding from the unknown we fear. Sooner or later a rogue wave will inevitably appear, and we’ll be dunked!
Until then, come on in, the water’s great! Just take the plunge.
This represents general information only. Before making any financial or investment decisions, we recommend you consult a financial planner to take into account your personal investment objectives, financial situation and individual needs.
Descriptions of data for experiment. Domestic Equities: Dimensional Australia Core Equity Index 100%. Global Equities: Dimensional Australia Global Core Equity Index (AUD) 50.0%, Dimensional Australia Global Core Equity Index (hedged to AUD) 50.0%. . 100/0: Bloomberg AusBond Bank Bill Index 2.00%, Dimensional Australia Core Equity Index 49.00%, Dimensional Australia Global Core Equity Index (AUD) 22.00%, Dimensional Australia Global Core Equity Index (hedged to AUD) 22.00%, Dimensional Emerging Markets Index (AUD) 5.00%. 90/10: Bloomberg AusBond Bank Bill Index 2.00%, Dimensional Australia Global Core Equity Index (AUD) 19.2500%, Dimensional Australia Global Core Equity Index (hedged to AUD) 19.2500%, Dimensional Australia Core Equity Index 42.500%, Dimensional Emerging Markets Index (AUD) 4.00%, Dimensional Global Real Estate Securities Composite Strategy 5.00%, Bloomberg Barclays Global Aggregate Bond Index (hedged to AUD) 8.00%. 80/20: Bloomberg AusBond Bank Bill Index 2.00%, Bloomberg Barclays Global Aggregate Bond Index (hedged to AUD) 13.00%, Dimensional Australia Global Core Equity Index (AUD) 16.7500%, Dimensional Australia Global Core Equity Index (hedged to AUD) 16.7500%, Dimensional Australia Core Equity Index 36.500%, Dimensional Emerging Markets Index (AUD) 3.00%, Dimensional Global Real Estate Securities Composite Strategy 7.00%, FTSE World Government Bond Index 1-5 Years (hedged to AUD) 5.00%. 70/30: Bloomberg AusBond Bank Bill Index 2.00%, Bloomberg Barclays Global Aggregate Bond Index (hedged to AUD) 13.00%, Dimensional Australia Global Core Equity Index (AUD) 15.00%, Dimensional Australia Global Core Equity Index (hedged to AUD) 15.00%, Dimensional Australia Core Equity Index 30.0%, Dimensional Global Real Estate Securities Composite Strategy 10.0%, FTSE World Government Bond Index 1-5 Years (hedged to AUD) 15.00%. 60/40: Bloomberg AusBond Bank Bill Index 2.00%, Bloomberg AusBond Composite 0+ Yr Index 8.00%, Bloomberg Barclays Global Aggregate Bond Index (hedged to AUD) 10.0%, Dimensional Australia Global Core Equity Index (AUD) 12.500%, Dimensional Australia Global Core Equity Index (hedged to AUD) 12.500%, Dimensional Australia Core Equity Index 25.00%, Dimensional Global Real Estate Securities Composite Strategy 10.0%, FTSE World Government Bond Index 1-5 Years (hedged to AUD) 20.0%. 50/50: Bloomberg AusBond Bank Bill Index 3.00%, Bloomberg AusBond Composite 0+ Yr Index 12.00%, Bloomberg Barclays Global Aggregate Bond Index (hedged to AUD) 10.0%, Dimensional Australia Global Core Equity Index (AUD) 10.7500%, Dimensional Australia Global Core Equity Index (hedged to AUD) 10.7500 Dimensional Australia Core Equity Index 21.500%, Dimensional Global Real Estate Securities Composite Strategy 7.00%, FTSE World Government Bond Index 1-5 Years (hedged to AUD) 25.00%. Assumed cash rate of return ascribed to unallocated money in plunge side of the experiment was determined by the monthly returns of the Bloomberg Ausbond Bank Bill Index between January 1990 and November 2020. Indices are not available for direct investment and performance does not reflect expenses of an actual portfolio. Portfolios constructed under AUD.